

Enable debug mode for your coding agent
- Select the organization you use with your agent.
- In the console header, click your agent’s icon, such as Claude Code or Codex. If it is hidden, open the +N menu and select it.
- Click Advanced settings, then open the Advanced tab. If the full settings dialog is already open, go directly to that tab.
- Turn Debug mode on and click Save changes.
- Send a new request from that agent through Edgee, then open Logs to inspect it.
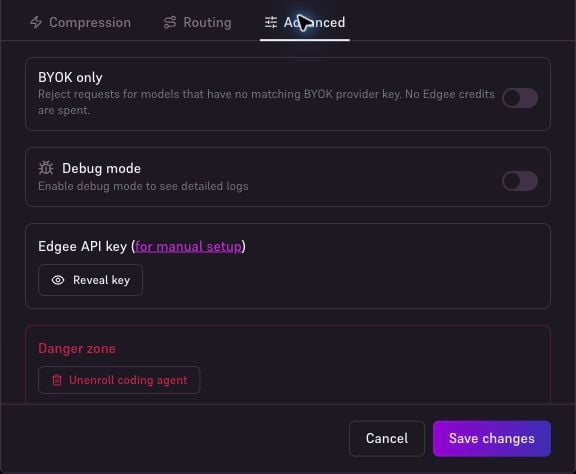
Advanced settings for a coding agent: enable Debug mode, then save changes.
Debug logs can include prompts, source code, tool output, and personal data. Enable capture only while investigating, then turn Debug mode off and click Save changes in the same dialog.
View the debug dialog
After enabling Debug, find a new request from the selected coding agent in Logs. Requests with captured debug data have a bug icon. Go to Logs in the console sidebar. Each row in the request table represents one LLM call. For requests captured with debug mode, click the bug icon in the rightmost column to open the debug dialog.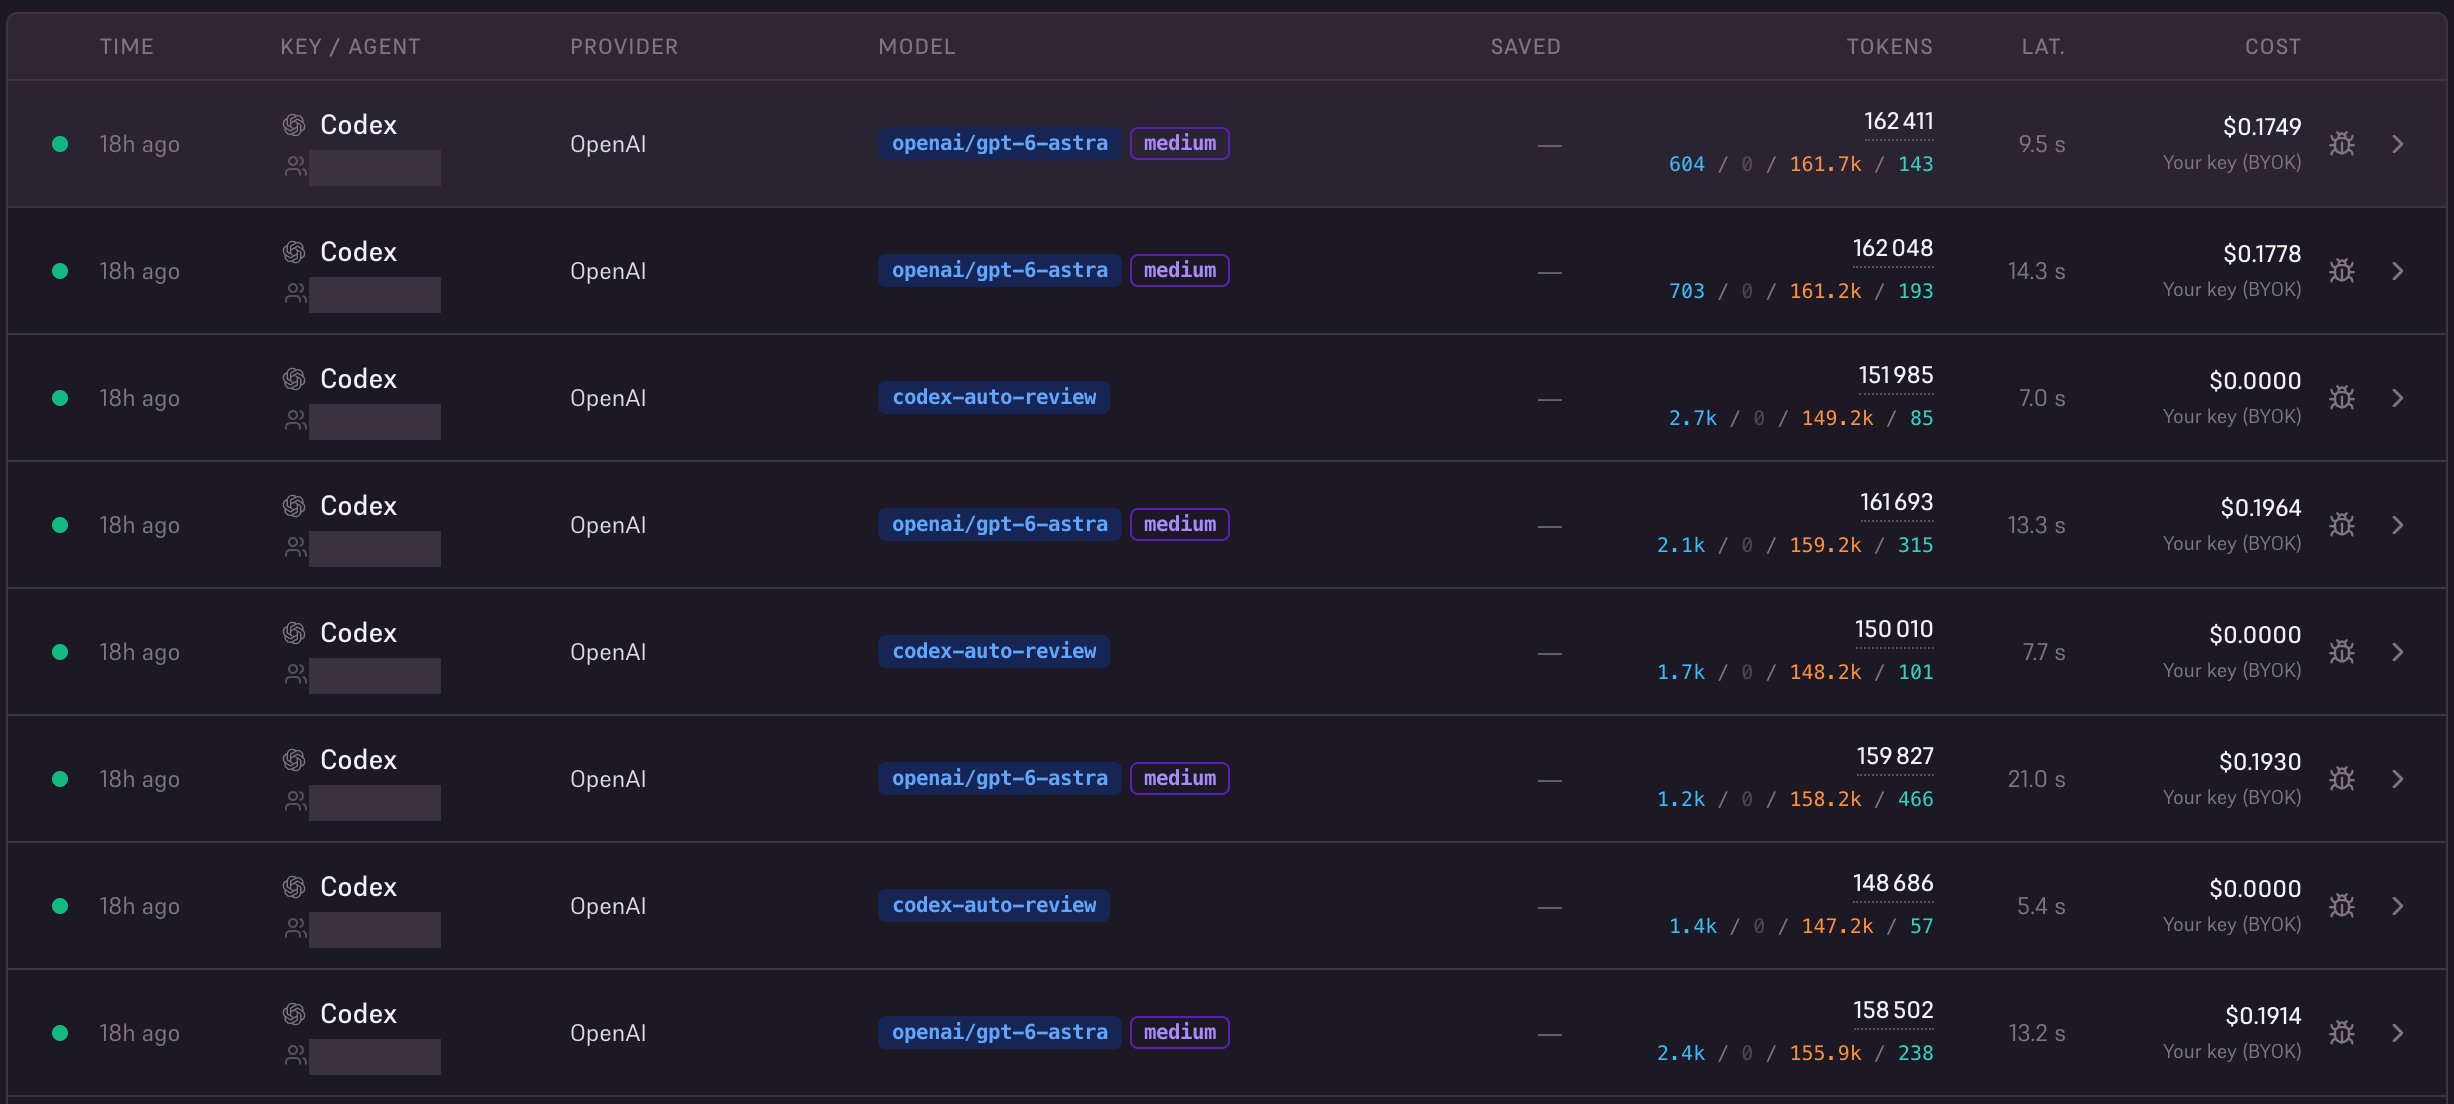
Click the bug icon beside a request to open its debug log.
End-to-end encryption (optional)
Set a passphrase for your organization to encrypt new debug logs. Only people with access to the logs and the matching passphrase can read their contents.Add your organization’s passphrase
- As an administrator, open Org. Settings → Gateway → Debug Log Encryption.
- Enter a strong Passphrase (at least 8 characters), then enter it again in Confirm passphrase.
- Store it securely in your team’s password manager, accessible to the people authorized to inspect debug logs.
- Click Enable Encryption. The panel displays Encrypted.
- With Debug mode enabled for your agent, send a new request and open its debug log to verify that it asks for the passphrase.
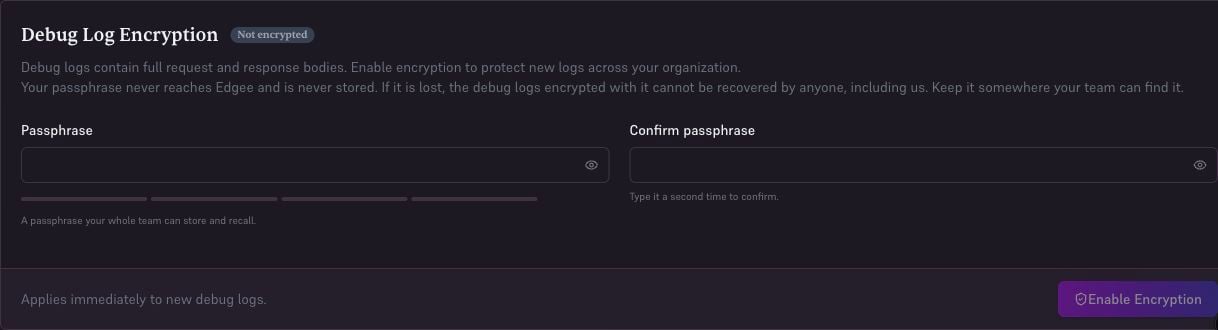
Set and confirm the organization’s passphrase, then enable encryption.
Your passphrase never reaches Edgee and is not stored by Edgee. If it is lost, logs encrypted with it cannot be recovered, including by Edgee support.
Read an encrypted log
Open the request’s debug dialog and enter the passphrase used when that log was recorded. Decryption happens in your browser; the passphrase is not sent to Edgee.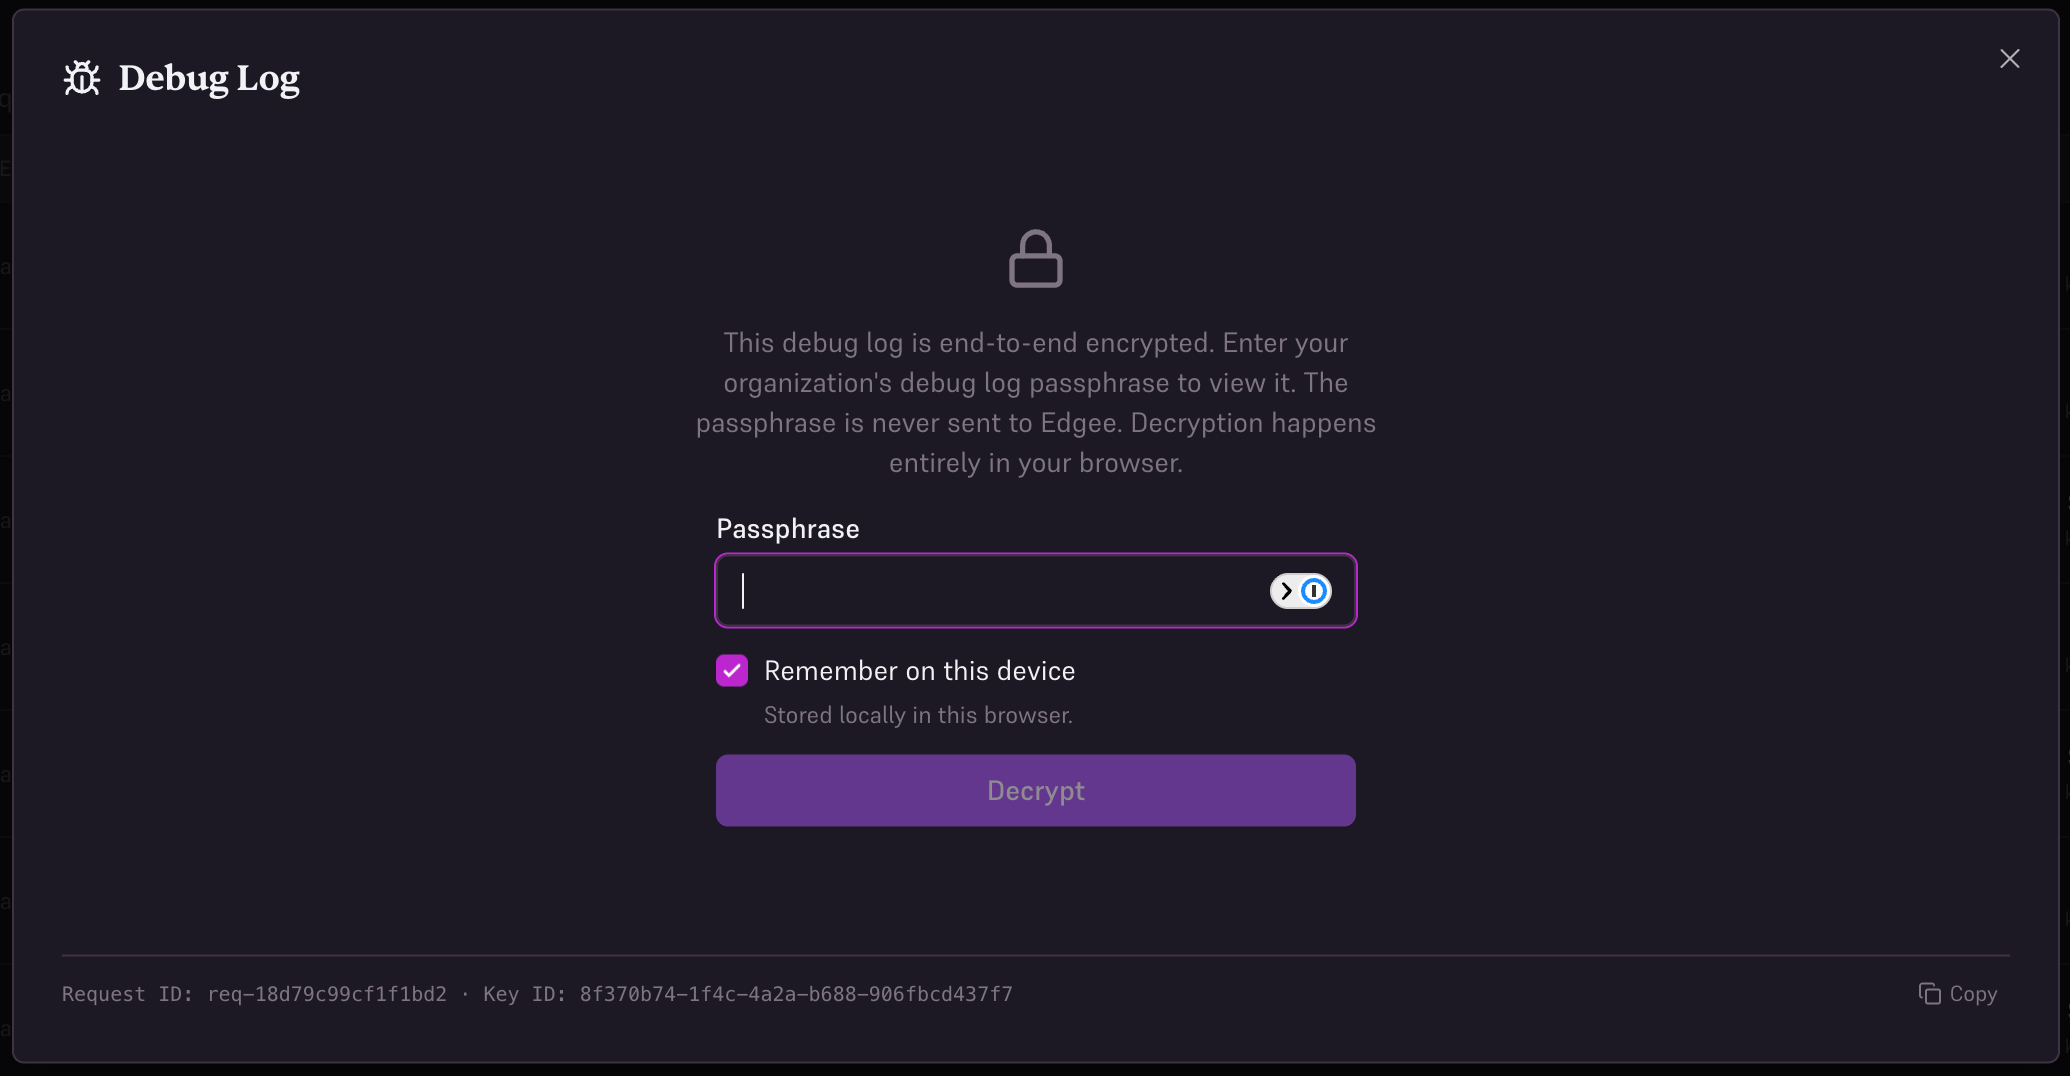
Enter the organization’s passphrase to decrypt the log in your browser.
Replace or disable encryption
- Replace Key: enter and confirm a new passphrase, then confirm the replacement. New logs use the new key; keep the old passphrase to read older logs.
- Disable: confirm with Disable Encryption. Future debug logs are stored without encryption. Existing encrypted logs still require their original passphrase.
How does the encryption work under the hood?
How does the encryption work under the hood?
Your browser derives an encryption keypair from the passphrase. Only the public key, salt, and key-derivation parameters are saved in the organization’s settings. The gateway uses the public key to encrypt debug logs; the passphrase and private key remain in your browser.
What the debug dialog shows
The dialog opens with full details about that specific request.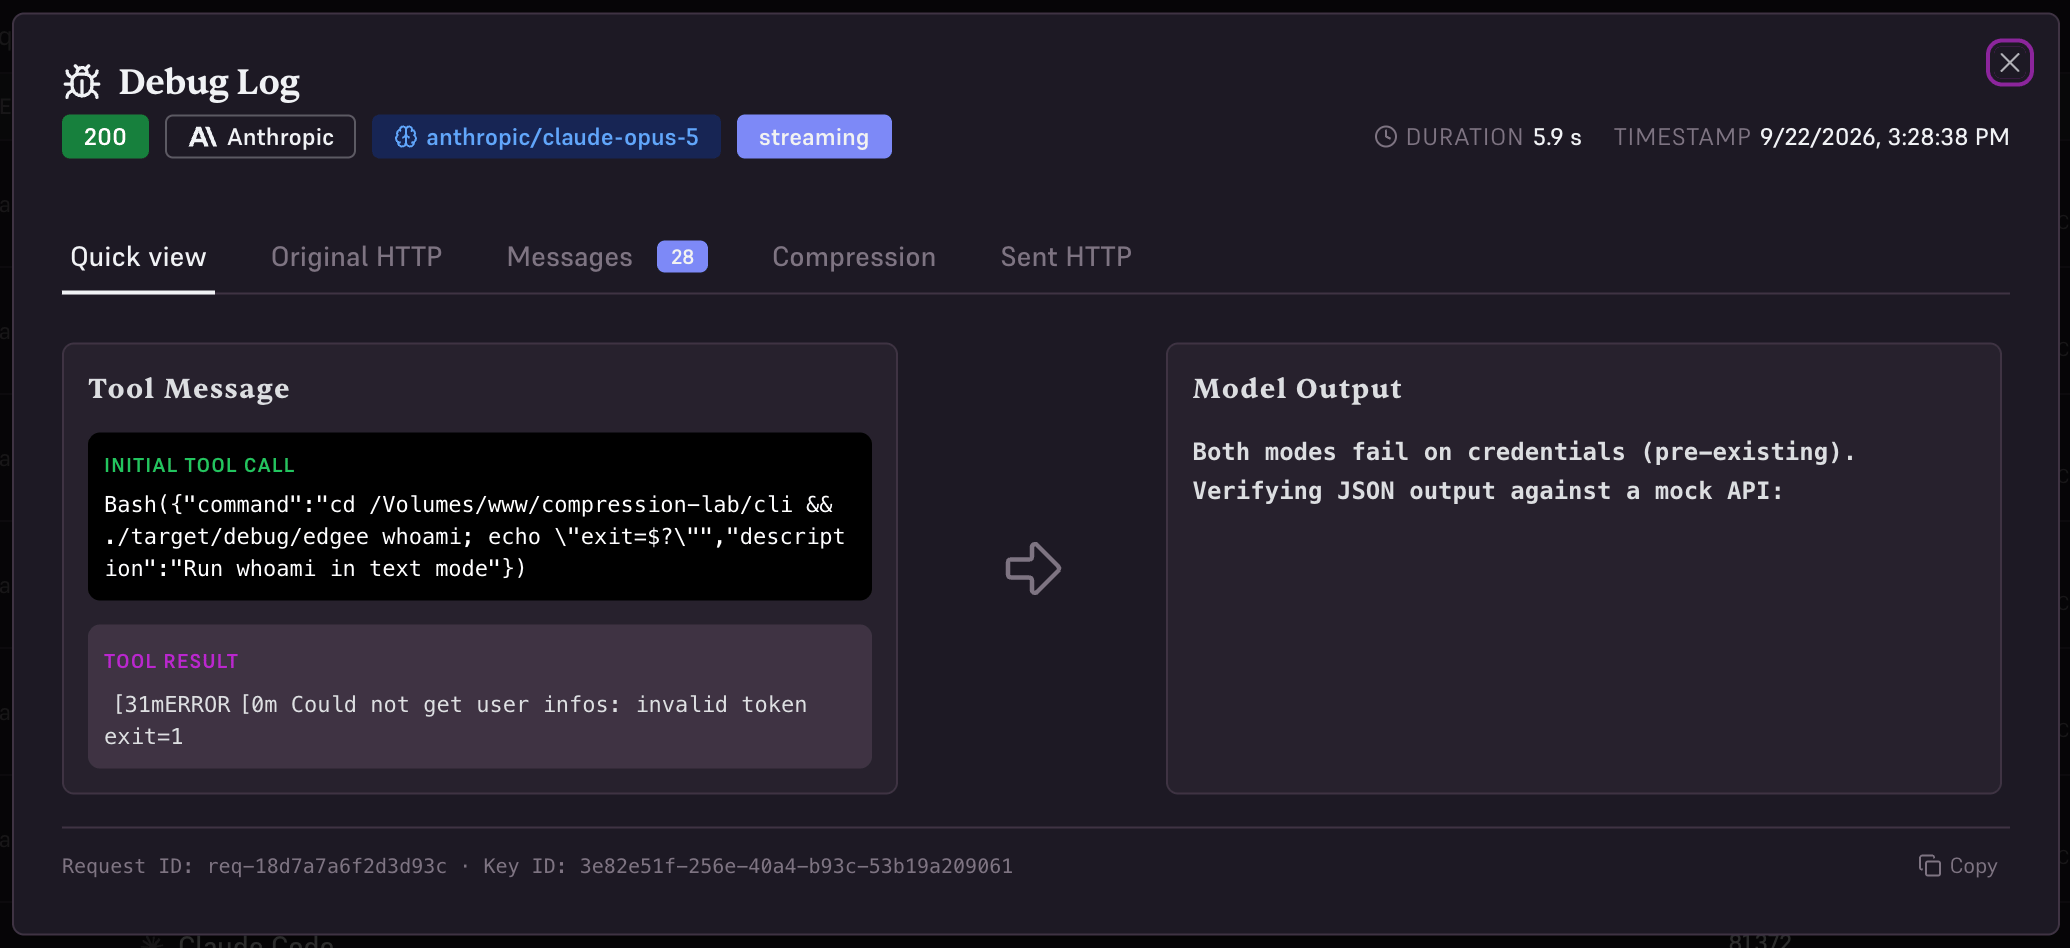
Quick view shows the tool call, its result, and the model’s output.
Metadata
A 3-column grid at the top shows at a glance:HTTP Request
The HTTP Request section (collapsible, open by default) shows everything Edgee sent to the provider. It is organized in tabs:- Full Body: The complete request body as an interactive JSON tree. You can expand/collapse nodes, switch to raw JSON view, and copy the content.
- Headers: All request headers in a key/value table. Sensitive values (such as authorization tokens) are displayed as
[REDACTED]. - Messages: The input messages array extracted from the body.
- Compressed: The compressed version of the messages, shown only when token compression was applied to this request.
- Compare: A side-by-side diff of the original and compressed messages. Each row corresponds to one message by index, so you can see exactly what was changed, shortened, or removed by the compression engine.
Output
The Output section (collapsible, open by default) shows what the provider returned:- Output (Response): The full response body for non-streaming requests, as an interactive JSON tree.
- Output (Accumulated Content): The concatenated streamed content for streaming requests.
- Output (Error): The raw error message in red if the provider returned an error or the request failed.
Request ID
The dialog footer displays the request ID in monospace. Use the Copy button to copy it, useful when filing a support ticket or locating a request from your coding session.Compression comparison in practice
When token compression is active, the Compare tab lets you validate what was actually sent:- Original message in the left column
- Compressed message in the right column
- Messages without a counterpart (e.g. if the array lengths differ) show a dash