

Read usage in the console
Start in Activity for organization trends, Team for member or squad costs, Sessions for one agent run, and Logs for one model request. Select the same organization, period, and filters before comparing values.Activity
Review costs, requests, token volume, and savings over the selected period. Displayed usage cost is not necessarily a deduction from Edgee credits, including when using a provider subscription or BYOK.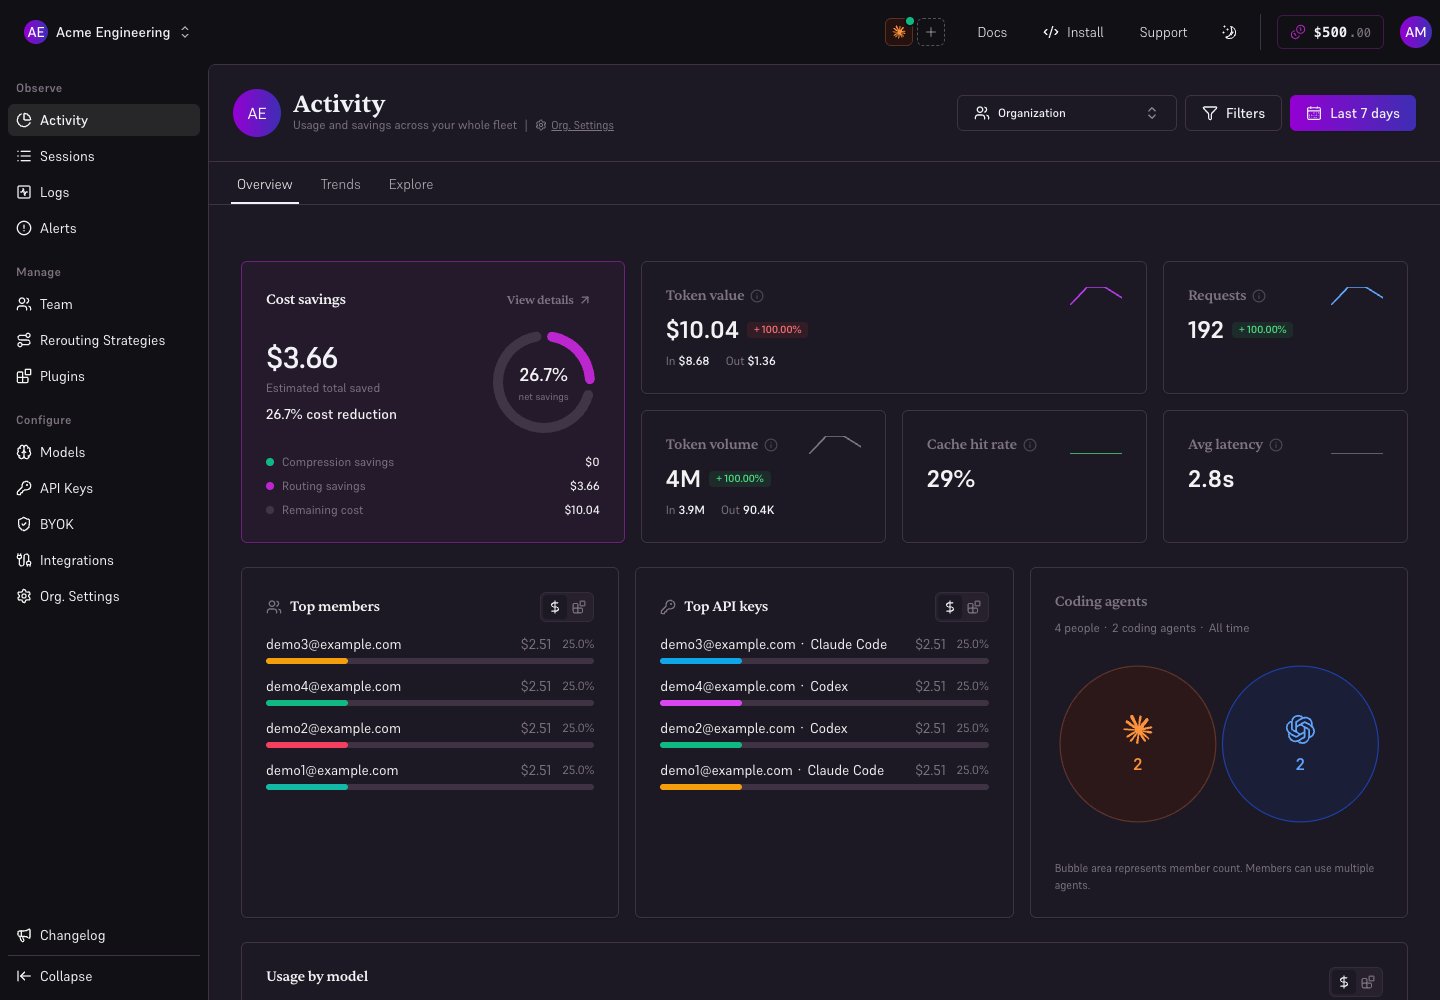
Local demonstration with fictional members and illustrative usage data.
Logs
Filter to the affected period, key, model, or provider. Open a request to compare the model requested with the model served, token counts, latency, cost, and errors. A reroute explains a model difference; a fallback can explain a provider change after an error.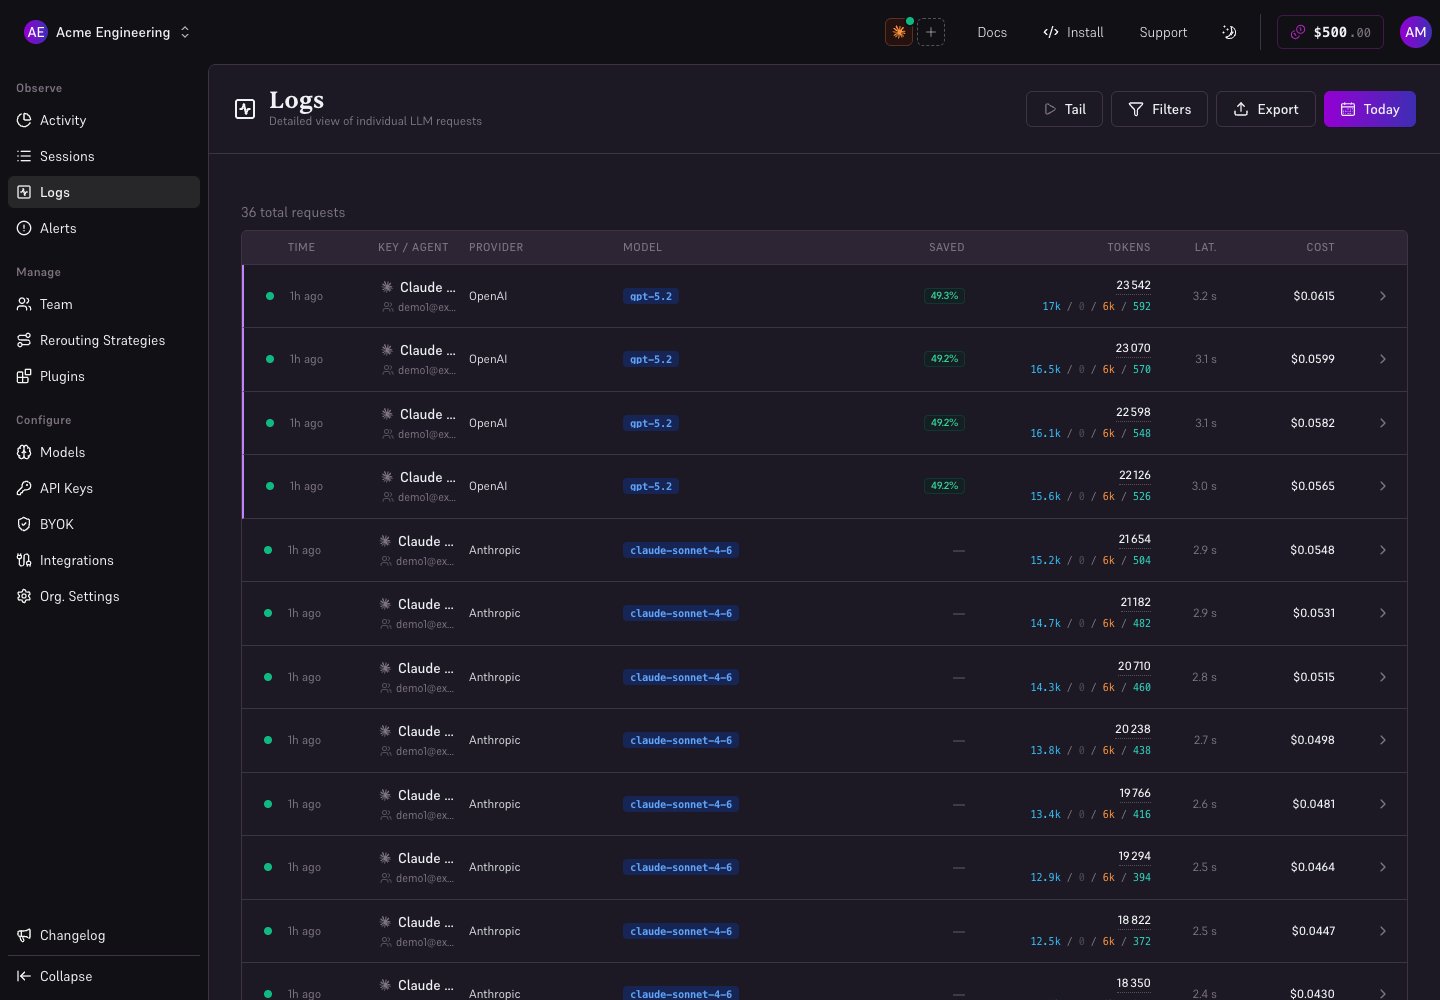
Local demonstration with fictional members and illustrative usage data.
Investigate an unexpected bill
- Find the period with the increase in Activity.
- Identify the member or squad in Team.
- Open their sessions and inspect the most expensive requests.
- Check routing, cache usage, model/provider, and the billing mode.
- Adjust the appropriate strategy or limit, then verify new requests.